Is this financial advice?
▾
No. TCG Quant is an informational tool that tracks quantitative supply and demand signals built from publicly available market data — eBay listings and completed sales, TCGPlayer pricing, and PSA grading populations. Nothing on this platform constitutes financial, investment, or trading advice. Past signal performance does not guarantee future results. Always conduct your own research before making any purchase decisions.
How often is the data updated?
▾
Everything rebuilds nightly. Pricing comes from TCGPlayer for every tracked product; supply and demand inputs (eBay active listings, DSR, days of inventory) refresh on the same run for Booster Boxes, Booster Bundles, ETBs and PC ETBs. PSA population data covers every set PSA publishes populations for — over 70 today — and is refreshed on its own cadence, since grading populations move slower than price. Legacy and monthly products carry a price momentum model instead of a supply signal, because their listing counts are too thin to read reliably.
What does the hit rate actually mean?
▾
Out of 440 historical signals tracked, 77.7% correctly identified a set that was in active supply contraction — meaning prices held or appreciated over the following 4 weeks. The average gain across resolved signals is measured at 4 and 8 week intervals. All pricing data is sourced from eBay and TCGPlayer, updated daily.
What markets does TCG Quant cover?
▾
Two things are worth separating. Signals and research cover 148 sealed Pokémon and One Piece products — SV and SWSH Booster Boxes, Booster Bundles, every ETB variant, SM and XY era, Ultra and Super Premium Collections, and One Piece OP-01 through OP-16 plus Extra and Premium Boosters. That is where the scoring, the boards and the grading analytics live.
Your portfolio reaches further: alongside everything above you can hold raw singles and graded slabs, cases and other sealed products, and sealed product from Magic, Yu-Gi-Oh, Lorcana, Gundam and Riftbound. Those five are priced and tracked, but they do not carry signals or grading analytics — we track them so your position is complete, not because we score them.
What's the difference between BUY SETUP, WATCH, and NEUTRAL?
▾
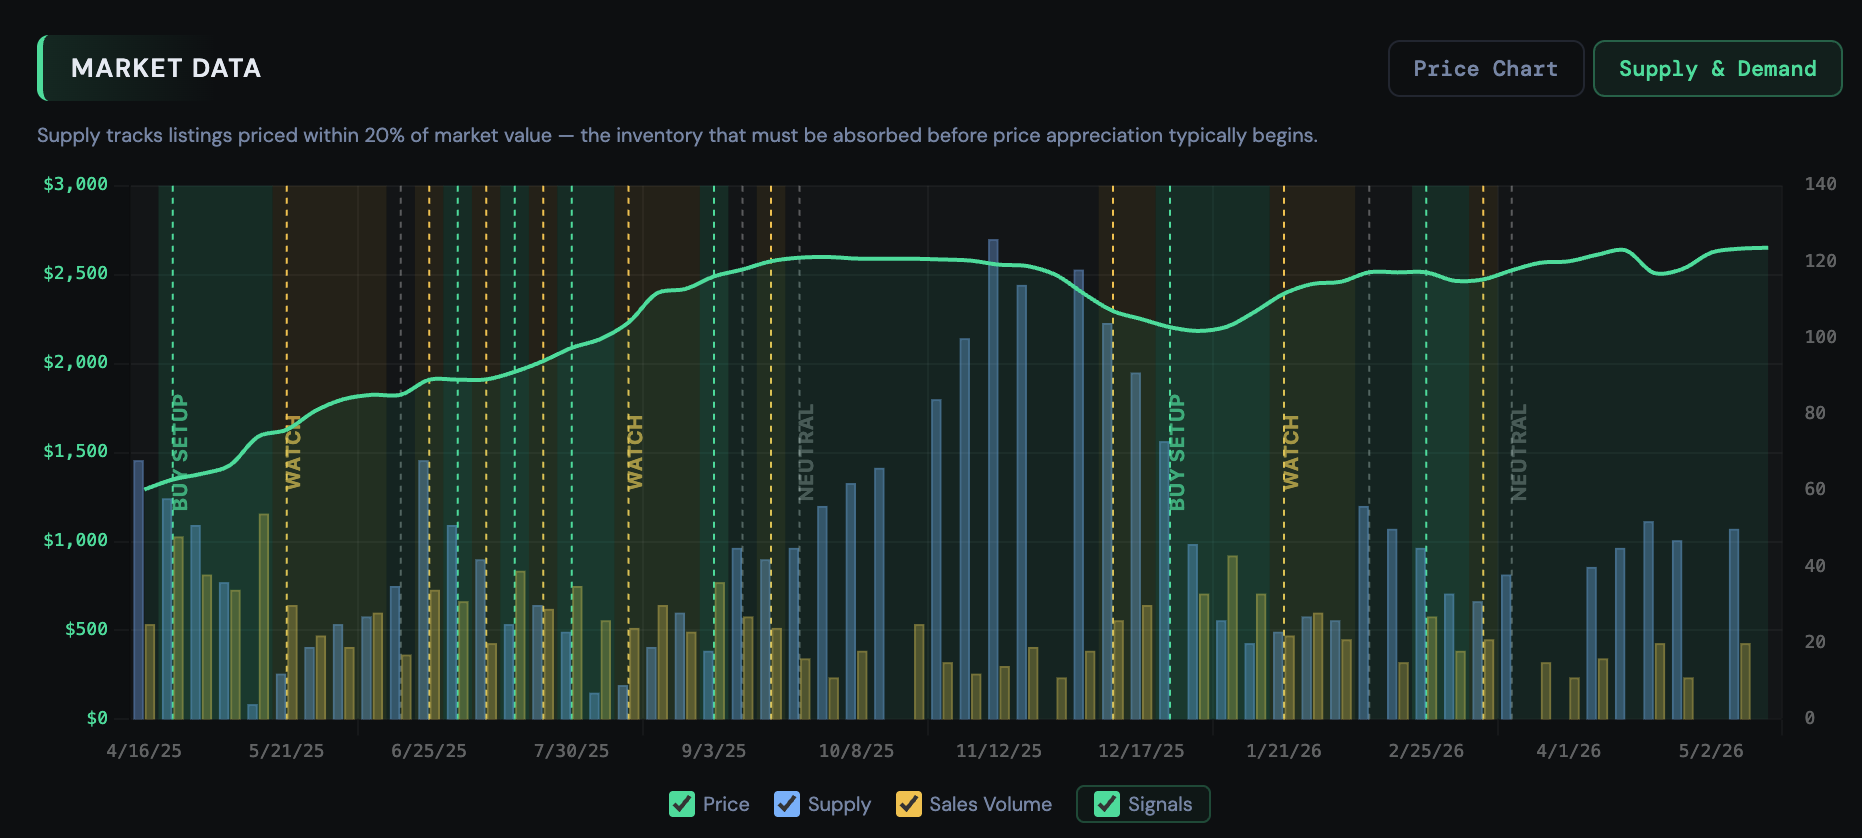
Each product scores 0–10 every build across four weighted components: demand pressure (DSR level and whether it is trending, 0–3), supply contraction over four weeks (0–3), days of inventory remaining (0–3), and a coiling pattern where supply falls while price holds flat (0–1). A score of 7 or higher is a BUY SETUP, 5–6 is a WATCH, and below 5 is NEUTRAL. It is a weighted score rather than a checklist, so a product can reach BUY SETUP on very strong readings in two components without maxing the third — and the dashboard shows every component so you can see which ones carried it.
Why do you use eBay data? What about TCGPlayer?
▾
eBay is the primary data source for all products because it represents the largest and most liquid secondary market for sealed TCG products, with the highest volume of completed sales. This gives us the most accurate real-time price discovery and reliable supply counts. The one exception is One Piece sealed cases — because case-level sales are extremely thin on eBay, we pull pricing data from TCGPlayer for that product type, which has better coverage of the case market. All other signals (Pokémon Booster Boxes, ETBs, Legacy Sets, UPCs, and One Piece Booster Boxes) use eBay sold listings exclusively.
What is the Destruction Tracker?
▾
The Destruction Tracker estimates how much sealed supply has been permanently removed from the market through box openings. When collectors open packs and submit cards to PSA for grading, those sealed boxes are gone forever. We track PSA population data across every set we have coverage for — over 70 today — to estimate the number of packs, boxes, and cases consumed. Higher destruction = less sealed supply remaining = stronger long-term price support.
What is the Set Explorer?
▾
The Set Explorer is a research tool that lets you deep-dive into any set across Pokémon and One Piece. It shows chase card pricing, pull rates, market data charts, supply and demand metrics, PSA grading activity, and Long-Term Thesis (LTS) scores. Browse by era or search for any set to see the full picture before making buying decisions.
What is the LTS (Long-Term Thesis) score?
▾
The LTS is a 0–10 investment thesis rating built from five weighted factors: chase card value (0–3), IP desirability (0–2), appreciation from MSRP (0–2), destruction momentum — how fast sealed supply is being opened and graded (0–2), and cultural milestone status (0–1). Scores of 9+ are Generational, 7+ Strong Long-Term, and 4+ Moderate. Hover any score in the app to see all five components for that set. One thing worth knowing: appreciation and destruction both need months of history, so a strong new release scores low at first — a low LTS on a recent set means unproven, not weak.
Can I bring in the collection I already track somewhere else?
▾
Yes. A CSV export from another app imports on any plan, including free. On Premium you can also drop in up to eight screenshots and we read them for you. Every row is shown to you for confirmation before anything is added — nothing is written to your portfolio without you approving it. If a product does not match our catalog automatically you can link it by hand afterwards, and it picks up live pricing from that point on.
Where does my portfolio data live, and can anyone else see it?
▾
It is yours and it is private. Holdings, cost basis and transaction history are tied to your account and are never shown to other users, published, or included in any public page. You can export your full transaction log to CSV at any time, and the Offer Sheet you send a buyer deliberately contains none of it.
Does the buyer see what I paid?
▾
No, and that is a deliberate design rule rather than a setting. The Offer Sheet shows only the items, the quantities and the price you are asking. Cost basis, unrealised gain, return multiples and how long you have held a position never appear on the buyer's copy. Every line does carry a TCGPlayer link and a completed-eBay-sales link so the buyer can verify your pricing independently — which is usually what a negotiation stalls on.
Do the portfolio values update on their own?
▾
Yes. Every tracked product, single and slab re-prices with the nightly build, so unrealised P/L, MOIC and ROI move without you touching anything. Graded slabs are marked to recent sales for the specific grade you hold rather than to a raw price. For anything genuinely untracked you can set your own mark, and the app labels it clearly as your figure rather than ours.
What is a sell target?
▾
A price per unit you set on any holding in your portfolio — the point at which that position is done. The row shows the target and how far away today's price is, and flips to target hit once the market reaches it. On Premium, the daily alert run emails you the day a tracked product crosses it. Targets are yours to change or clear at any time, and they never appear on an Offer Sheet.
What alerts can I get, and how often do they send?
▾
Three kinds, all Premium. Holdings alerts measure what you own against what you paid: up or down by a threshold you choose, a thesis that broke (a product you hold stopped being a buy setup), and a sell target reached. Watchlist alerts cover products you do not own yet: it became a buy, it dropped sharply, or it reached a price you named. Discord carries the daily signal changes. Rules are evaluated once a day against the fresh build and everything that fired arrives in one email, with what you own listed first. They trigger on a change, not while a condition holds, so nothing mails you every morning.
Can I cancel my premium subscription?
▾
Yes — you can cancel anytime from your account page. No contracts, no annual commitment required. If you cancel, you'll retain premium access through the end of your current billing period.
 V.8
V.8